Problem
Dashboards turn into walls of numbers. A manager needs fast comparison, not a decorative report.
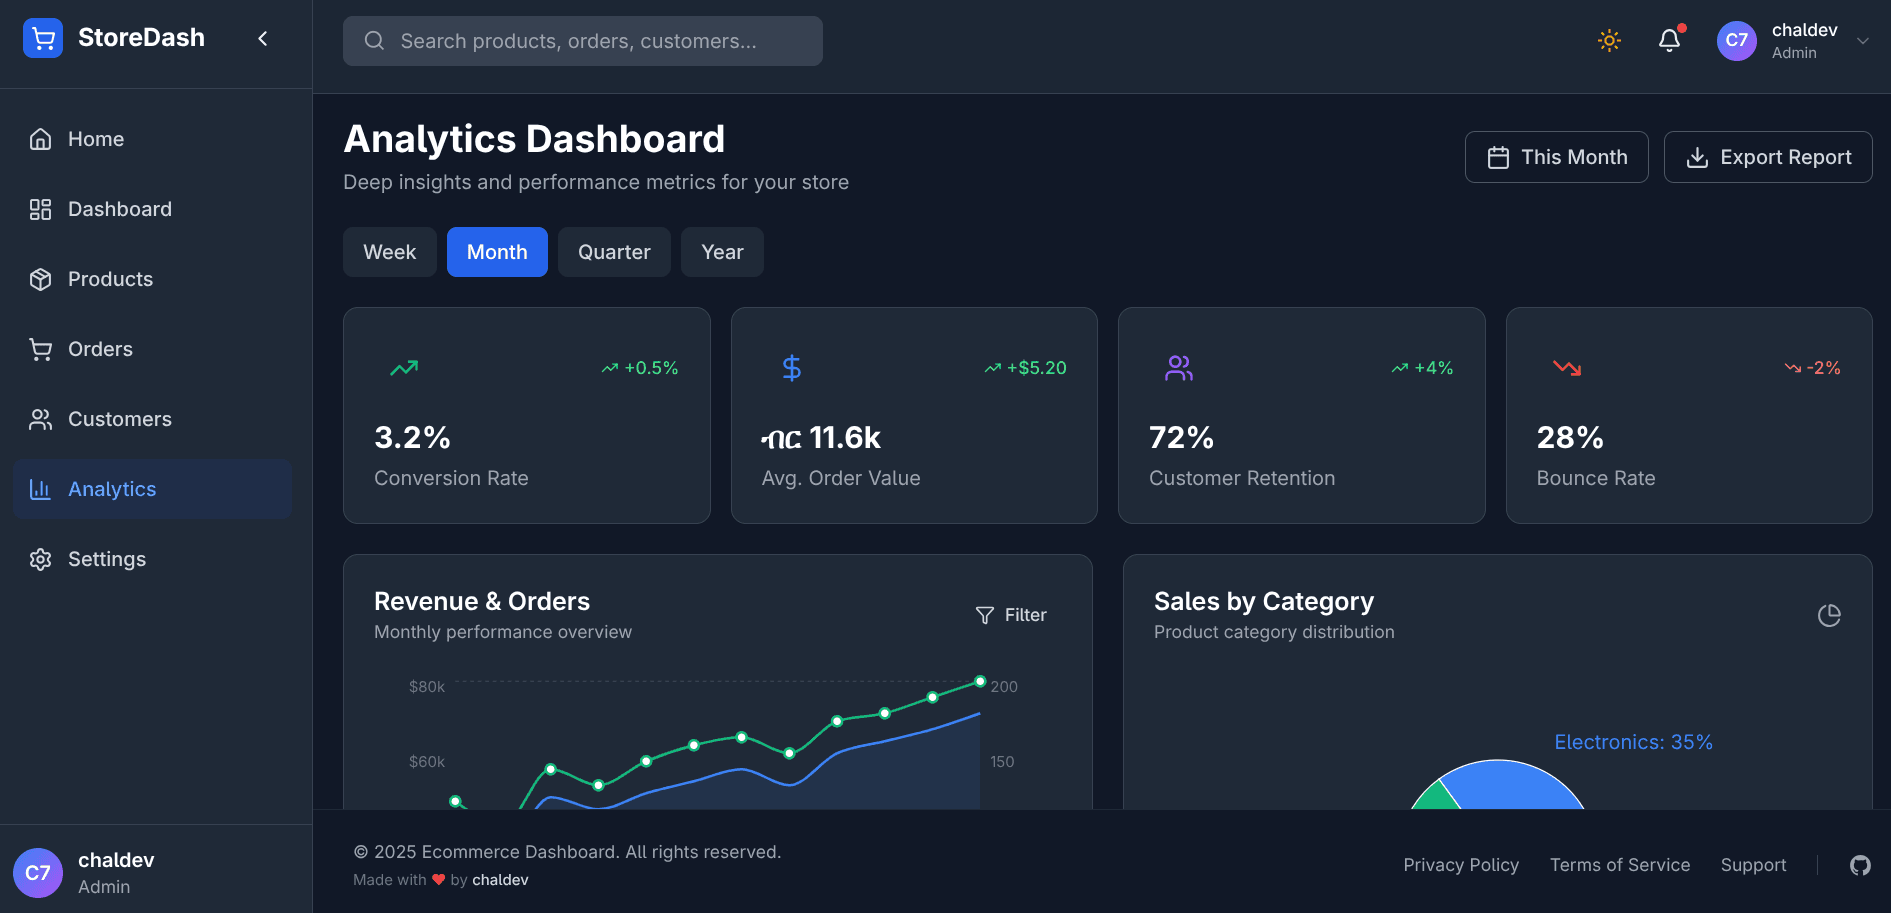
Dashboards turn into walls of numbers. A manager needs fast comparison, not a decorative report.
A React dashboard built from reusable metric, inventory, and chart components with a layout system tuned for dense information.
Typed KPI, table, and chart components; a grid layout that collapses predictably; charting isolated behind a small wrapper so the library can be swapped.
Balancing density with breathing room.
A dashboard succeeds when it helps people answer a small set of repeated questions quickly.
A deployed prototype that shows how I structure information-dense UI.